

Research on how crypto and tokenized assets trade, with the code to rerun it.
Unexpected Correlations is Aperiodic’s research blog. We study order flow, liquidity and the real cost of trading perps on stocks, indices, gold, oil, FX and crypto, and publish what we find.
Our studies come with the method in full and the code, so you can rerun them on the same data. We publish what didn’t work as well as what did.
What we publish
Studies. A question about how a market trades, answered with a model tested out of sample. The latest: We trained a model on 25+ stock perps: we made money on nights & weekends but lost it all in market hours.
Replays. Market events rebuilt minute by minute from every trade and quote, like the Binance hack on 29 October.
Notes. Shorter reads between studies, on what the market just did.
The data behind it
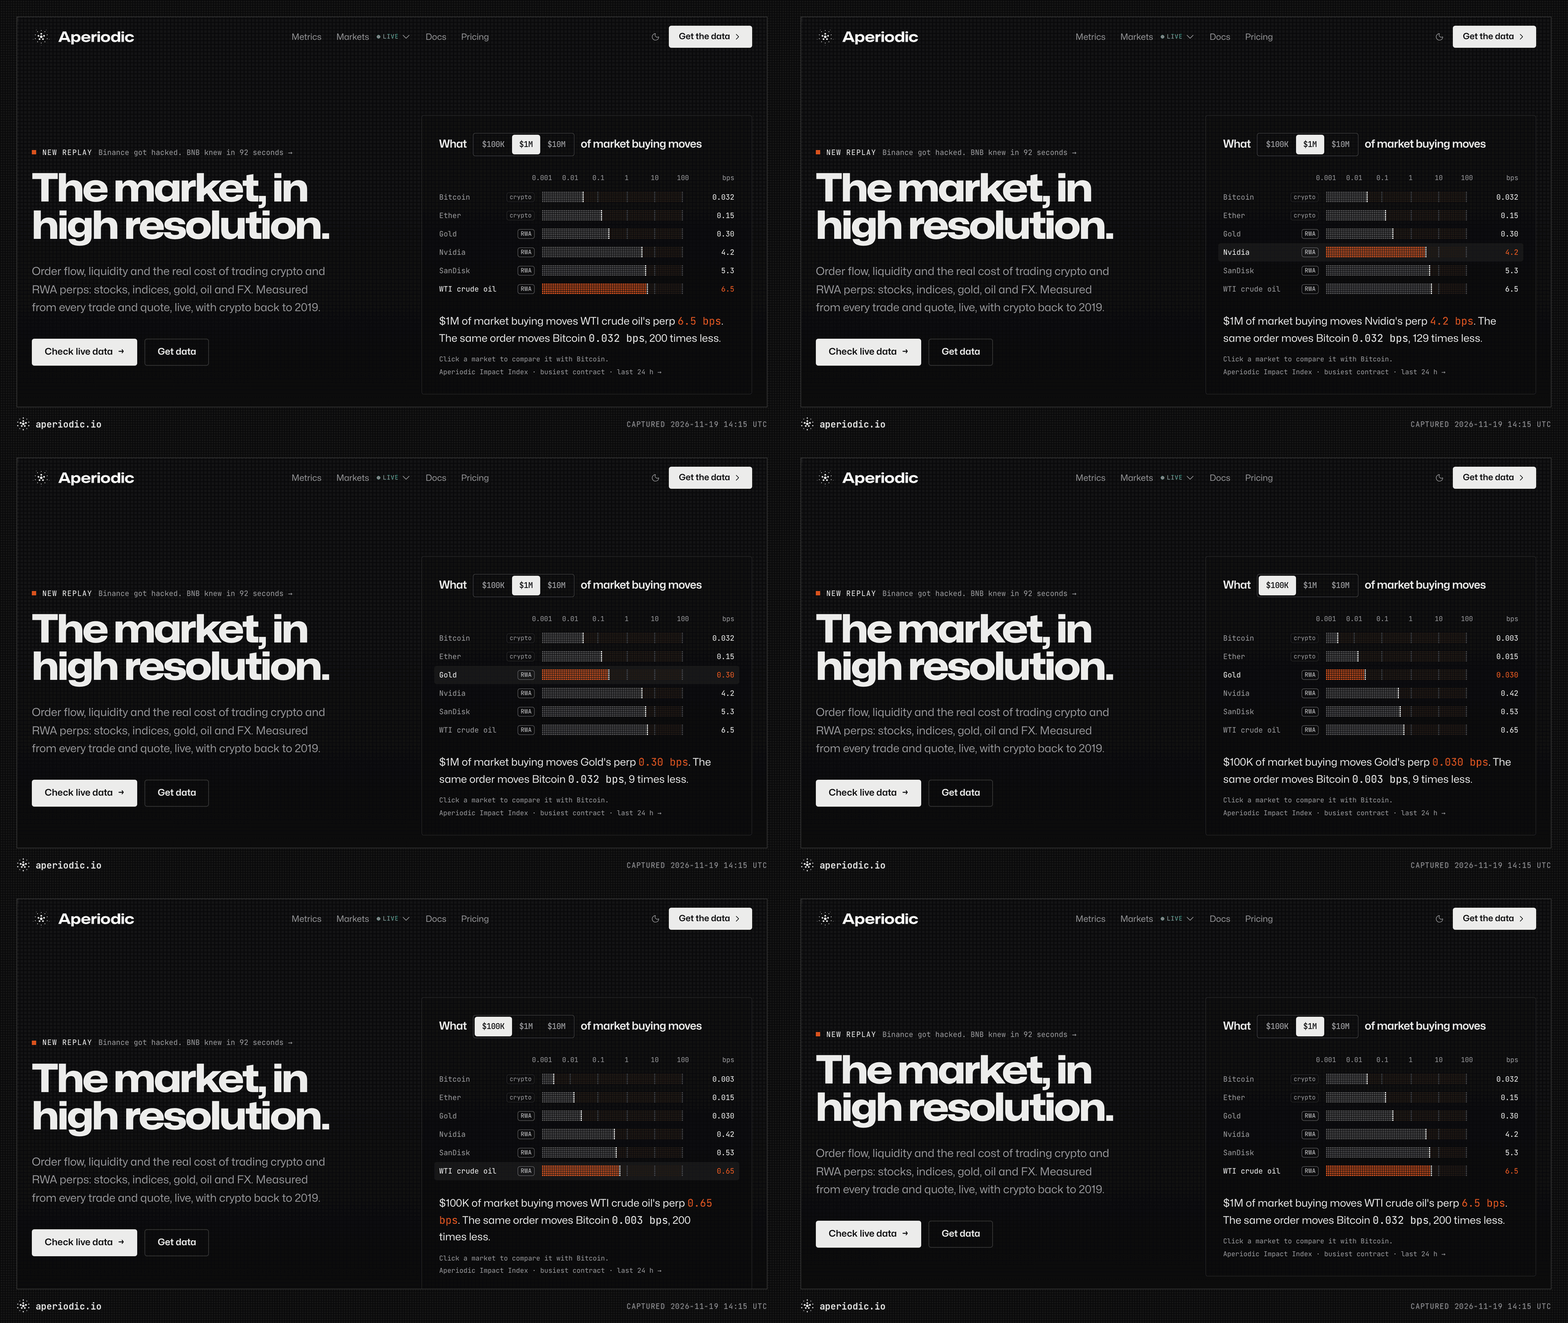
Aperiodic measures the market from every trade and quote on Binance, OKX and Hyperliquid: 220 metrics on order flow, liquidity and cost, and three indices built on them, Cost, Depth and Impact. It covers crypto and tokenized assets alike, with crypto back to 2019. You get it as Parquet through a REST API, a Python SDK, a CLI, or an MCP server for your AI agent.
A free key gets you every metric for 2025 on BTC, ETH, SOL and 10 tokenized assets, no card needed.
Who we are
Daniel Szemerey and Mark Aron Szulyovszky founded Aperiodic and run it as co-CEOs. We built the pipeline for our own trading desk first, then for partner institutions, and have now opened it to everyone who does research.
If you need help with data, reply to any of our emails or talk to us.